


The 1% rule
An oft-repeated rule of thumb for single family home real estate investors is something called the “1% rule.” Simply put, this means that monthly rents should equal to at least one percent of the purchase price of the home. This is a quick-and-dirty way to check whether a home has cashflow-generating potential. In other words, will there be much left over after all expenses are paid?
Where to find the 1% rule
Ten-plus years ago, finding areas in D-FW that met this requirement was easy. They were everywhere. You could throw a rock and hit one, as almost anything that wasn’t high-end was not far from the magic 1% rule of thumb.
Today, the situation is more complex. A few minutes on a typical listing site is an exercise in frustration. Clicking on a few random homes for sale, you find that rents divided by asking prices are nowhere near 1%. So, you click a few more, and then a few more. Scratching your head, you think to yourself, “do they even exist, and if so, where?”
The landscape in 2021
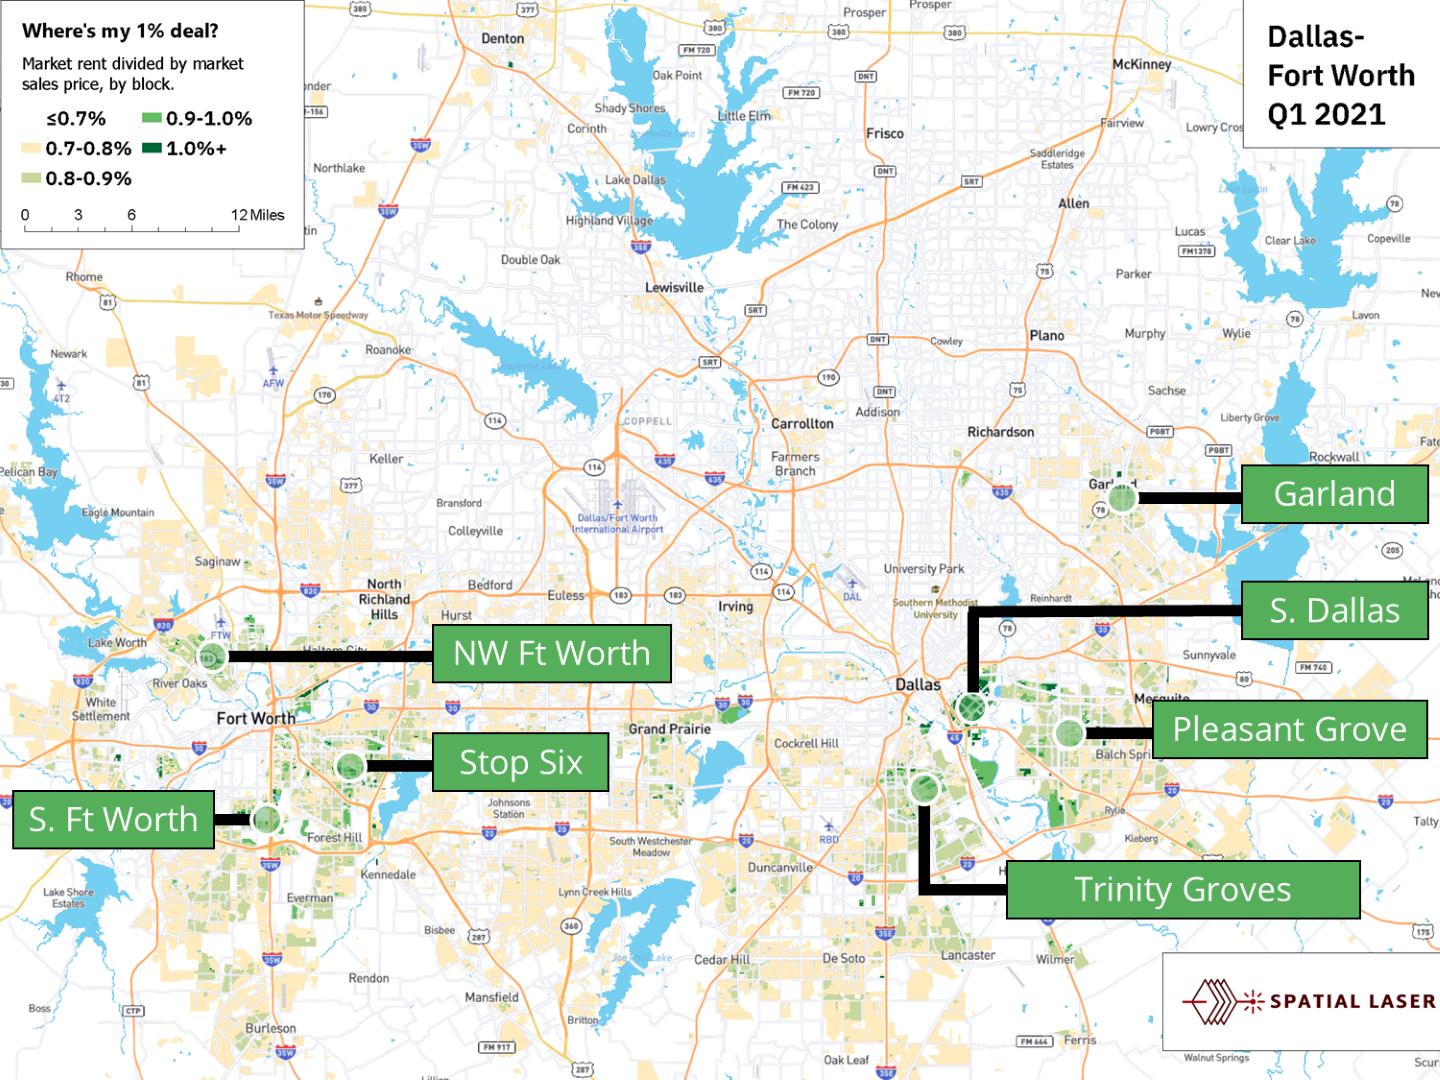
In the late 2010s, areas that met the 1% rule became rare. The COVID-era price spike has made them even more rare. This is the reality of where we are in the market cycle, which has been on the upswing for over a decade, and accelerated recently due to tight inventory and in infusion of money into the economy.
A few small pockets where 1% deals are common show up in green below. In today’s market, you will have to “make do” with a ratio that is slightly lower than 1%. Based on the map below, many areas, colored in orange/tan, still fall within the 0.7 to 0.8% range, which is not bad.
The 50% rule
The 50% rule is the other rule that is taught in real estate investing 101. It means that you should assume your expenses in operating that property will consume half of the property’s income. What if we actually calculated gross margin (income minus some key expenses) and mapped it? Some of the same areas light up, but with some differences. First, more areas outside of the “near 1% rule zones” light up as potentially good for gross margin.
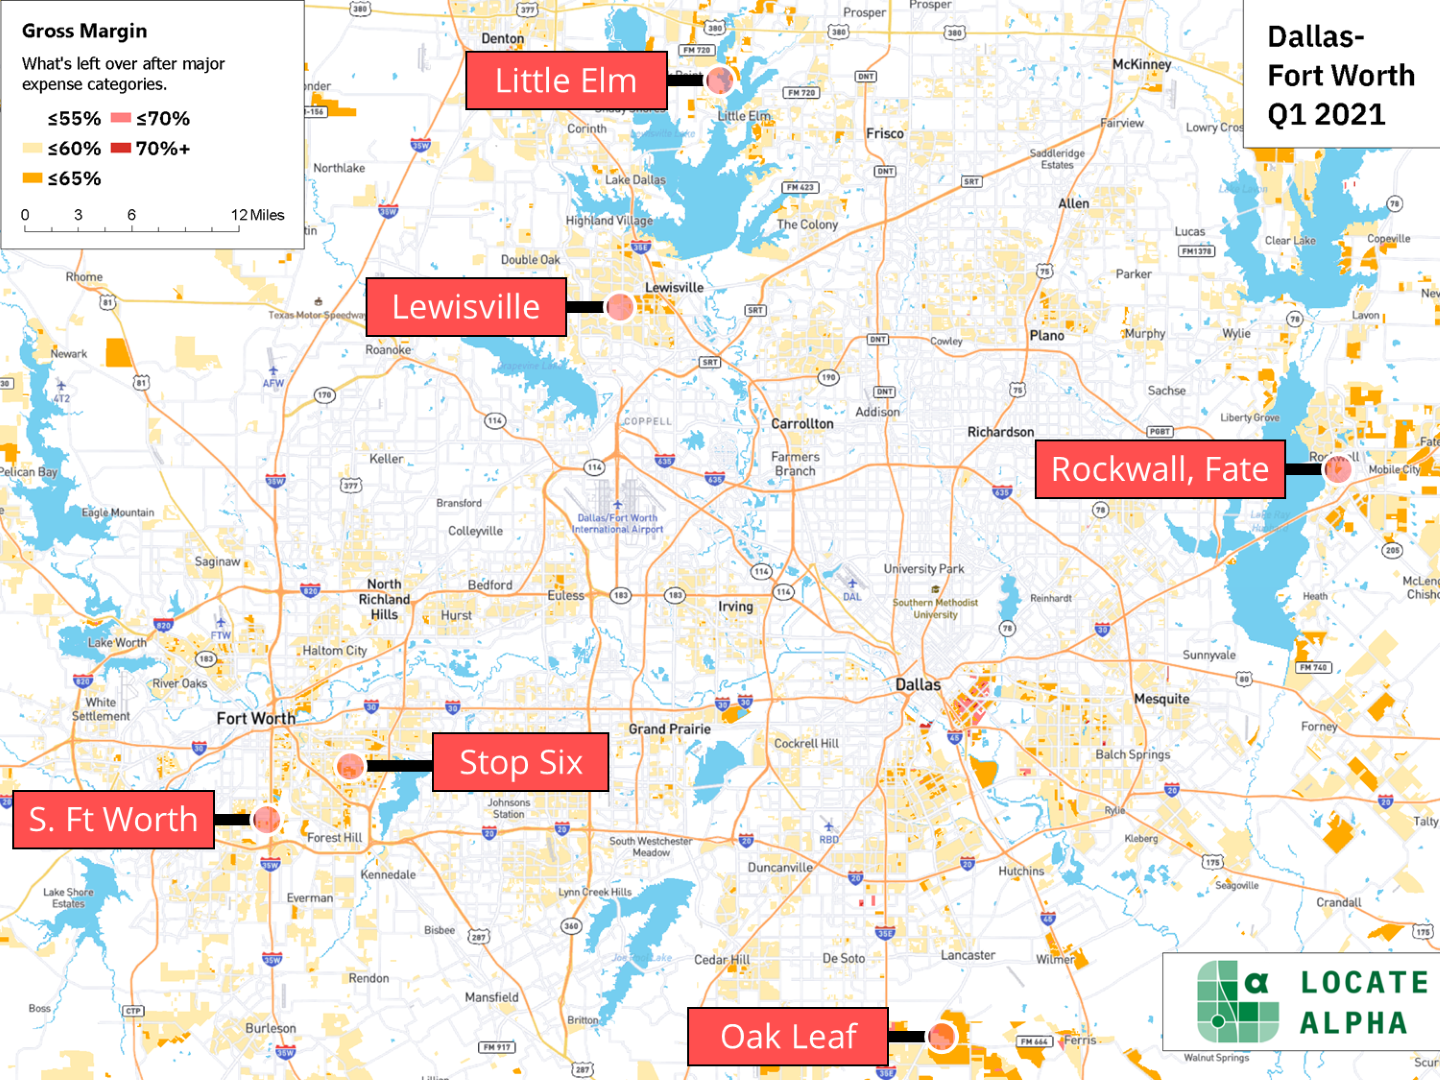
Expenses assumed here include taxes, HOA fees, insurance, and management fees. Other expense categories are ignored for the moment but will be captured next…
Introducing…the mighty cap rate
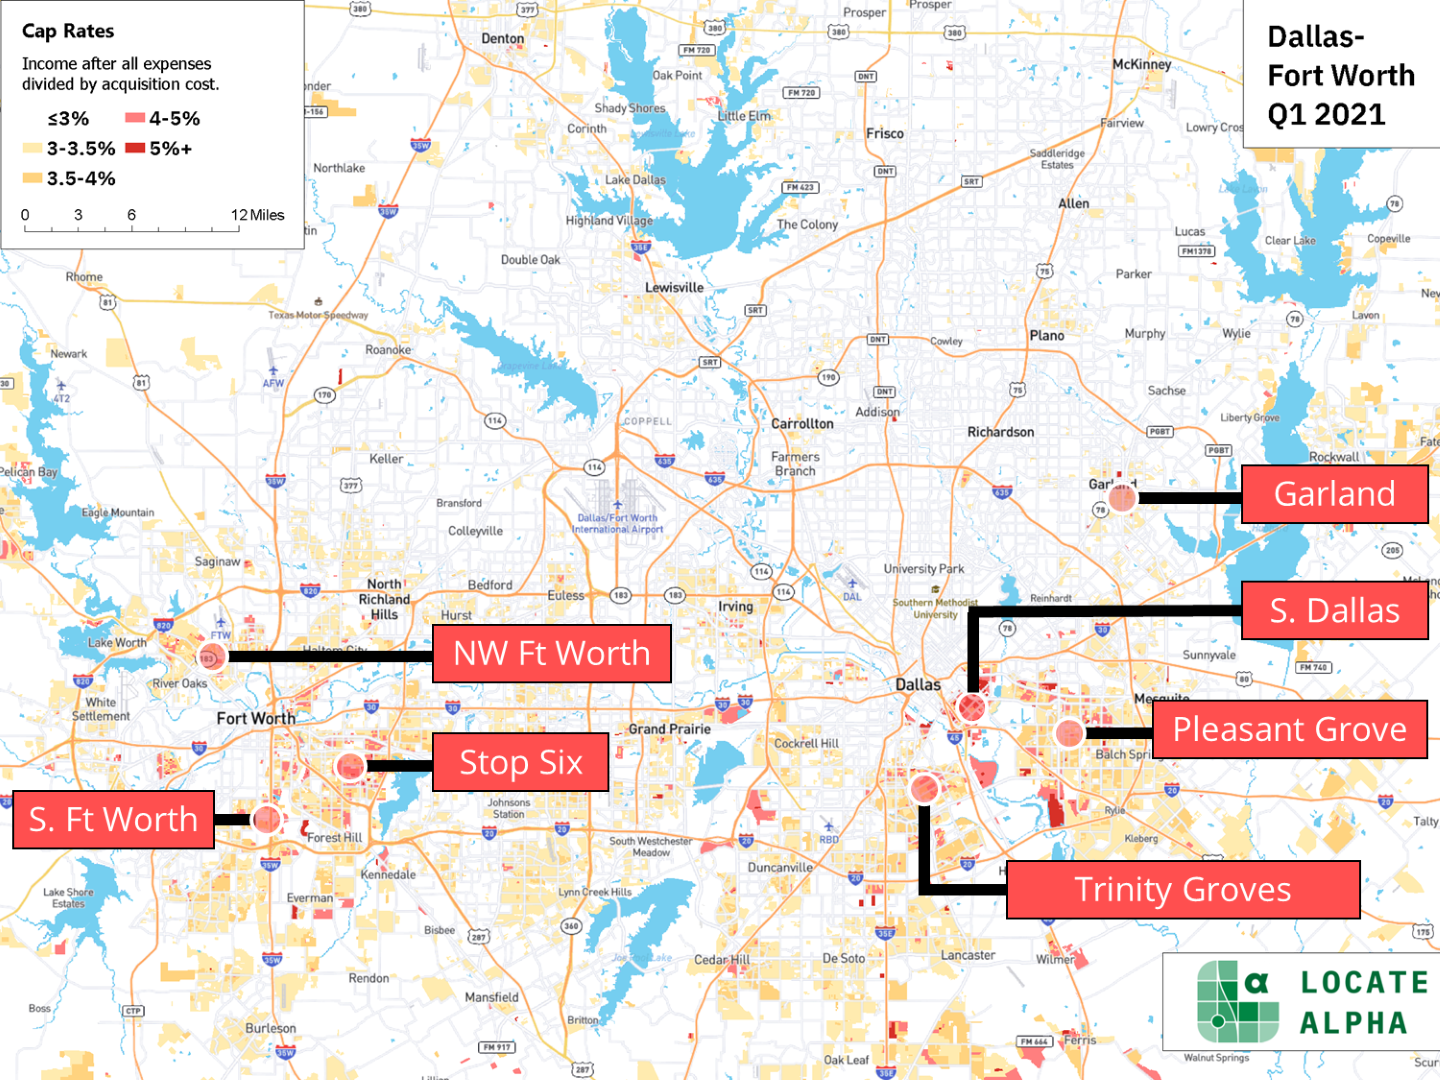
The cap rate is a concept common in the commercial real estate world, for large income-producing properties and isn’t commonly heard in single-family residential. It is focused specifically on income after all expenses. And when we say “all”, we mean “all.” Not just PITI and other basic expenses.
We factor in maintenance, leasing costs, and other categories of costs that are commonly under-estimated and have a way of sneaking up and catching you by surprise. We have calculated what these look like for every block, based on how long leases tend to run in that exact location and how often you will need to turn over the property.
Purchase price is also adjusted to include your expected rehab costs, based on the age of the homes and adjusted for the level of wear-and-tear we expect in that neighborhood.
The result is a more nuanced view of where to find cashflow. There are some overlaps with the previous maps but also some key differences.
Where are rents increasing?
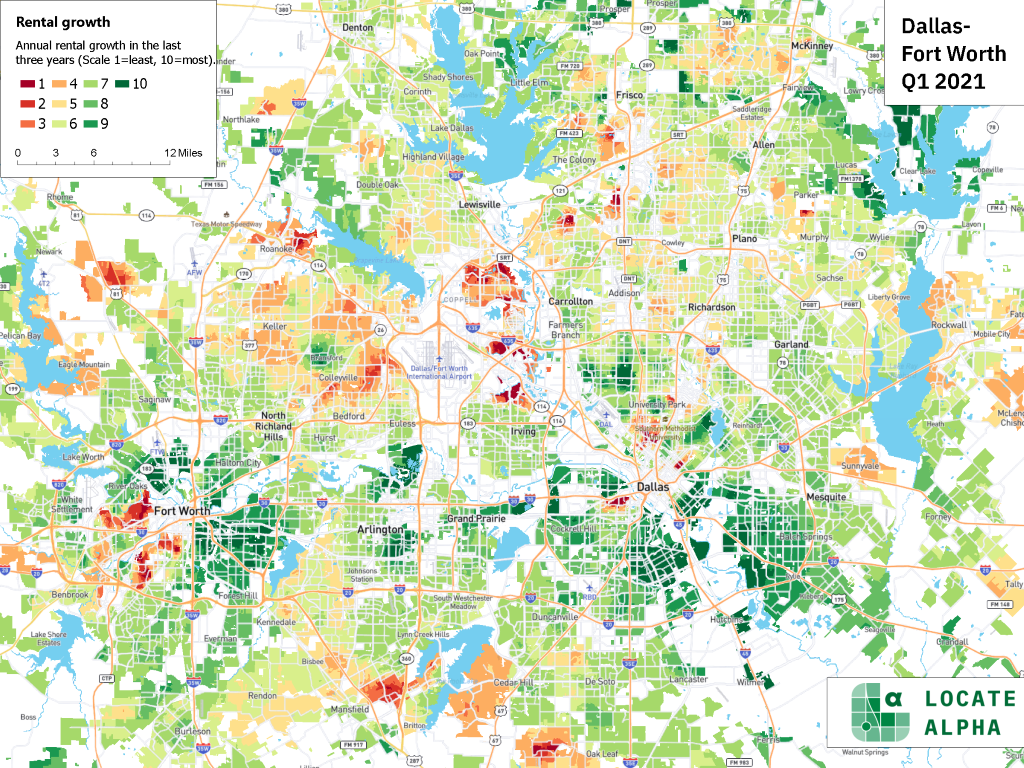
Rental increases are driven by local supply and demand, influenced by what’s happening in only a few miles’ radius. We have calculated how this looked in the last few years. The areas in green really saw rents rocket upwards.
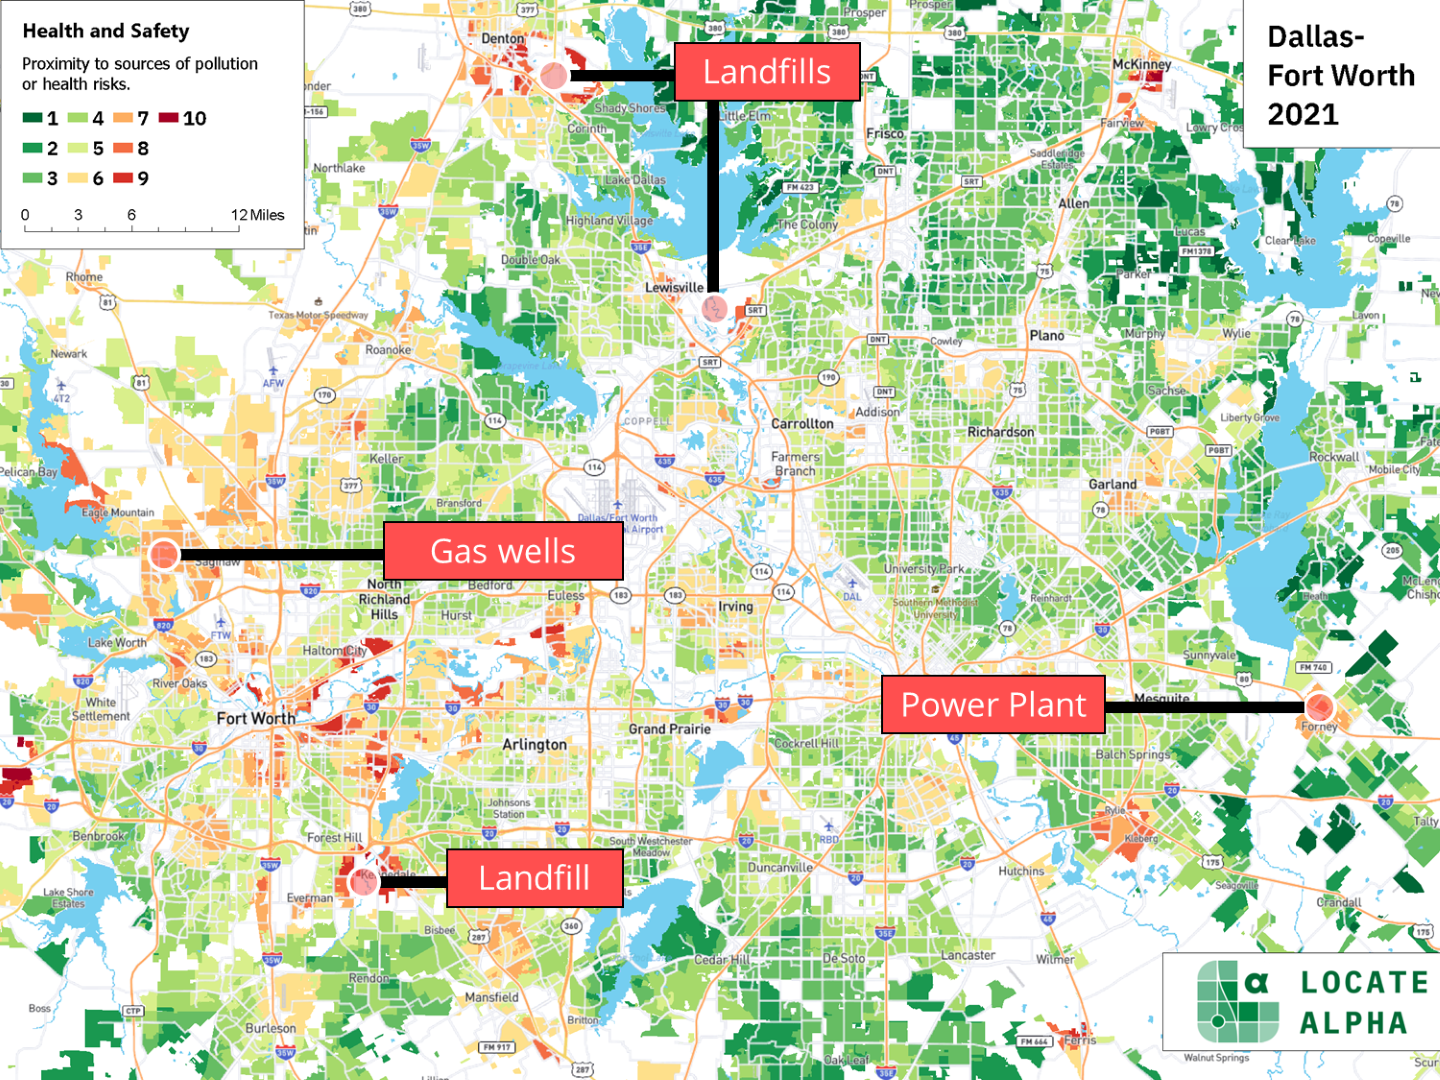
High return = higher risk?
High returns are one thing, but what about risks? Do you want your property to be next to a landfill? A power plant? What about gas wells? Nobody knows for sure if they are a bad thing, but maybe you don’t want to deal with tenants that might think there’s a health issue. You can find out easily with a map like the one below, where red means “stop” and green means “go.”
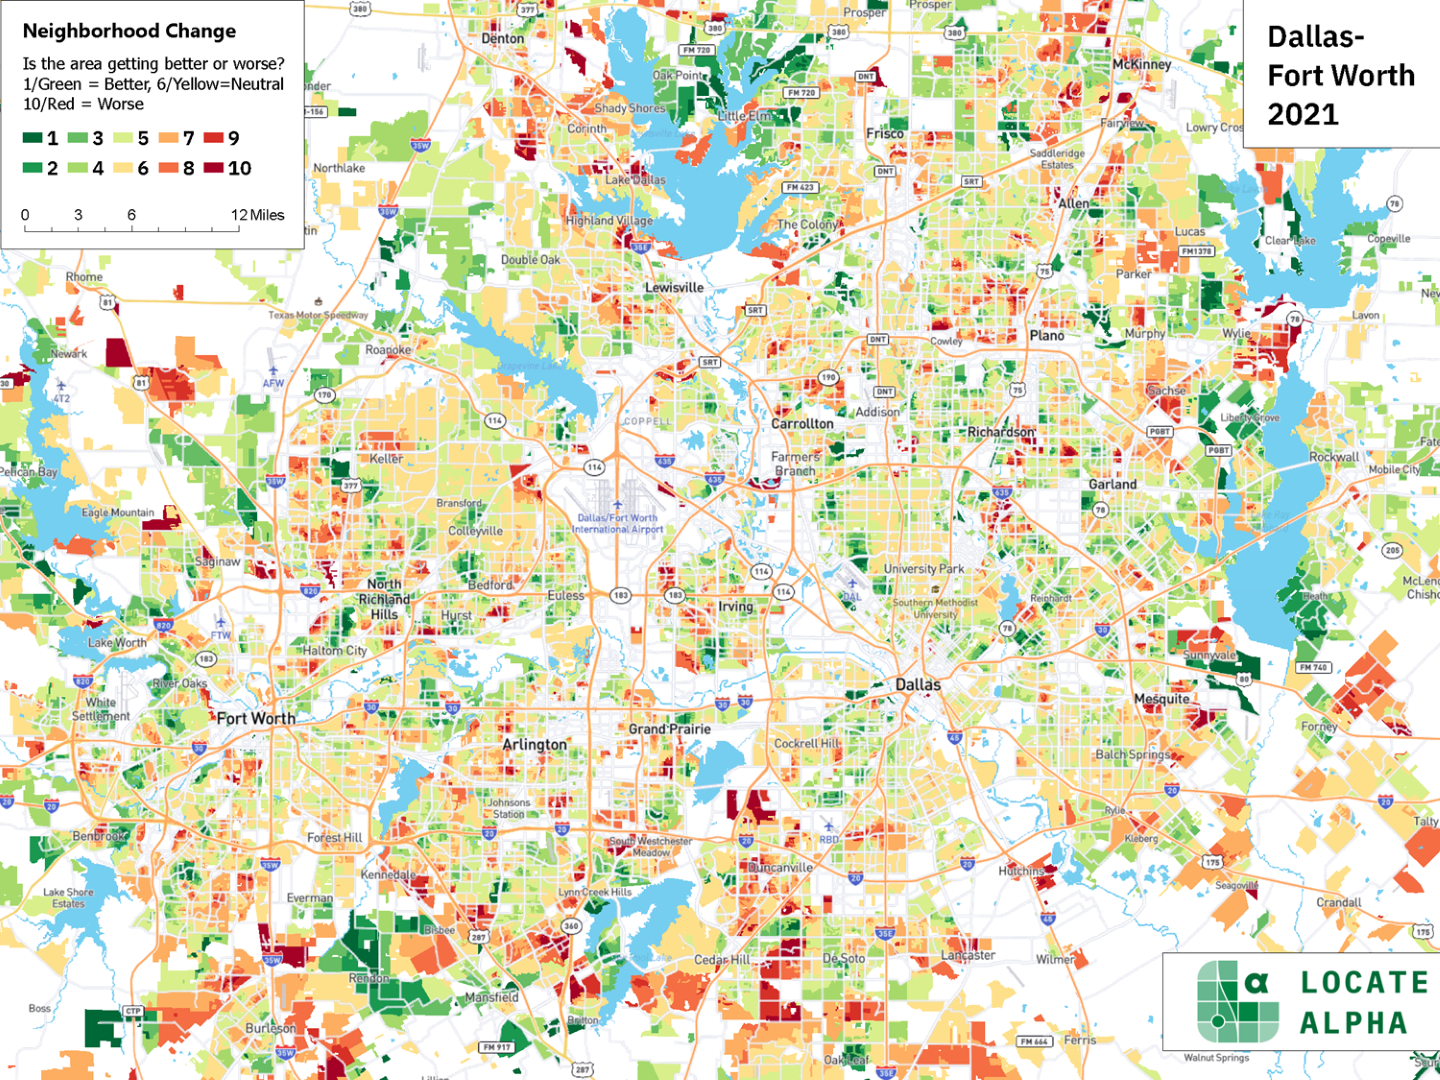
Should you invest in a neighborhood that is getting worse? Or one that that is getting better? Probably the latter. Before you go cross-eyed staring at this checkerboard of a map, the key message is clear: these changes happen at a very small scale — from neighborhood to neighborhood, and even from block to block.
Why should I believe your figures?
We’ve crunched the data based on thousands of data points, so you don’t have to. No longer do you need a huge team to do this analysis, because it’s all been done already. We’ve shown you enough. You’re well on your way to forming a smart investment strategy. Go off and explore!


