
Steering clear of the roller-coaster housing markets, at the city and neighborhood level
Stock analysts often speak of the “beta” indicator as a measure of risk. Why not apply the same thinking to U.S. housing markets? It is useful for a property investor to know if a location has a history of incredible booms followed by epic busts, relative to the national average. A bit of consistency is not a bad thing, is it?


One size does not fit all
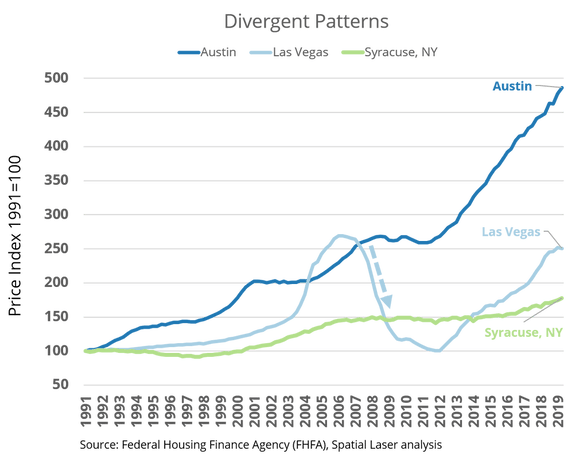
There is no such thing as “one” national housing market. After all, some places in the U.S. have experienced some very sharp peaks and troughs over the years, and others weathered the global recession with very little effect on housing prices.
At Spatial Laser, we often hear about the “sand states” and their high volatility. Examples include metros like Las Vegas, the inland areas of California, and Arizona, which experienced sharp pricing drops in the last cycle. Meanwhile, the Austin metro has continued to rise in a stepwise fashion, with each pause followed by yet another price surge. If we compare these cities to look for historical downside risk, it would be the cities following the Las Vegas pattern.

Using “beta”
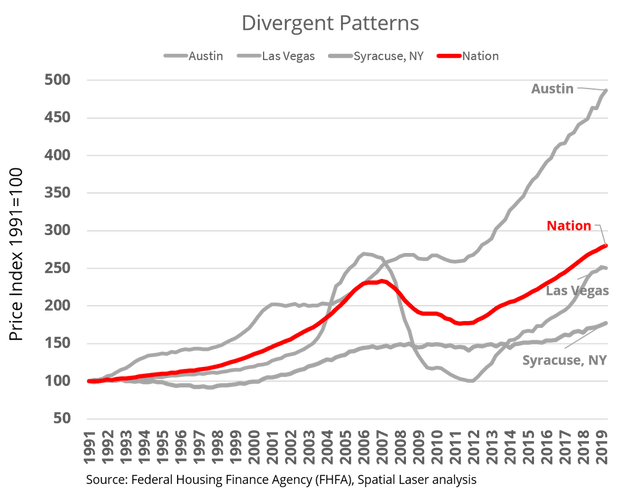
We can quantify that using the beta measure. The idea is to compare each city against the national average trend, a basket of “all” metro area prices indices. Combining all metros is the same idea as the using S&P 500 as a benchmark for the entire stock market. Markets that move up and down in tandem with the national average have a beta of 1. A city with beta closer to zero, meanwhile, is less correlated to what most other cities are experiencing. These cities move to their own rhythm and offer useful diversification benefits. They may go up and away – like Austin, or, are the slow and steady markets like Syracuse. Conversely, a beta of 2 means double the ups and downs of the country as a whole.


Finding the “safer returns”
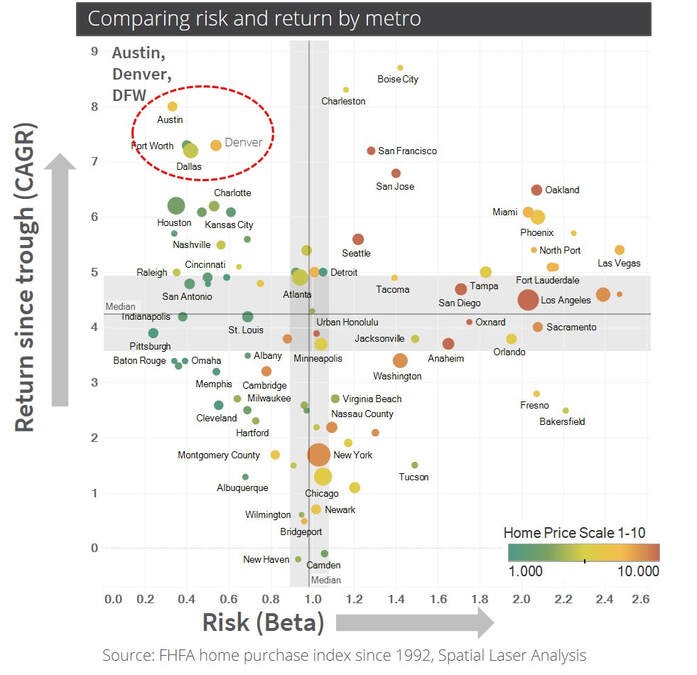
Volatility is one thing, but appreciation is another. Who wouldn’t want the best of both worlds? On the chart below, we show historic risk (beta) plotted against the average annual appreciation of each market since the last market bottom (generally around 2009). Of course, past performance does not guarantee future returns, but this makes for an interesting start to the discussion. Austin, Dallas, Fort Worth, and Denver are all showing solid returns combined with limited price volatility. To show the relative footprint of each market, the size of the dot indicates the population of the metro area. From a portfolio theory perspective, it makes sense to take a deeper dive on these upper-left quadrant markets that seem to offer a better combination.

Drilling down to the micro level
If we can do it at the city level, why not do it at the neighborhood level? Sure enough, we can. The idea is the same – we measure the price movements of each neighborhood compared to the national average trend.
This is very important because of the large differences within a single metro area. While the metro area sets the general tone of the market, some sub-markets and neighborhoods are significantly more volatile than others. This is one example of where the micro analysis made possible by Spatial Laser becomes critical in planning an investment strategy.
Areas that are high-beta have probably been exposed to greater market swings due to factors such as: 1) greater swings in the supply-demand balance of homes due to inexpensive land and more new housing starts, 2) housing where affordability is more sensitive to interest rates, 3) proximity to industries that experience sharper cycles in growth and labor force size 4) greater exposure to cross-state migration from other cities at different points in the market cycle.
Meanwhile, the low-beta neighborhoods are insulated from big swings and offer a more steady path to growth with less downside risk. There is a belt of “low beta” mature neighborhoods about 15 miles from the Dallas central business district which seem to show the best resilience and greatest degree of decoupling from price movements nationally.


Putting it all together: one way to identify winning locations
The past 20 years of growth, and the volatility of that growth, can be combined into an index to compare areas. Based on this Dallas-Fort Worth example, areas around White Rock Lake, Richardson west of 75, and Northwest Dallas are all areas that have been standout performers for the last two decades on both fronts.


